

Author: Doug Junor, VP of Innovation
In this 2-part blog, you’ll learn how AI is helping organizations protect lone and remote workers by shifting safety from reactive reporting to predictive prevention. We’ll break down the differences between lagging and leading indicators, why research questions traditional measures like TRIR, and what “predictive safety” looks like in real field operations. You’ll also see how Field Safe is incorporating AI into an all-in-one platform to surface early risk signals, strengthen hazard and control quality, and help teams act sooner to prevent incidents.
Key Takeaways:
Why traditional safety metrics miss risk markers and how AI + leading indicators change the game for lone workers
If you’re responsible for lone and remote workers, you already know the toughest part of the job: when something goes wrong, help is often far away. The distance, weather, and remoteness can all conspire to turn routine tasks into high-risk work. Lone workers are particularly vulnerable because they don’t have a coworker beside them. Thanks to AI-powered digital safety apps, lone workers are no longer completely alone.
Organizations are collecting more safety data than ever before, including GPS locations, check-ins, journey plans, incident reports, and wearable alerts. The challenge is no longer “Do we have data?” It’s “Can we actually see the patterns in time to do something about them?”
That’s where AI comes in.
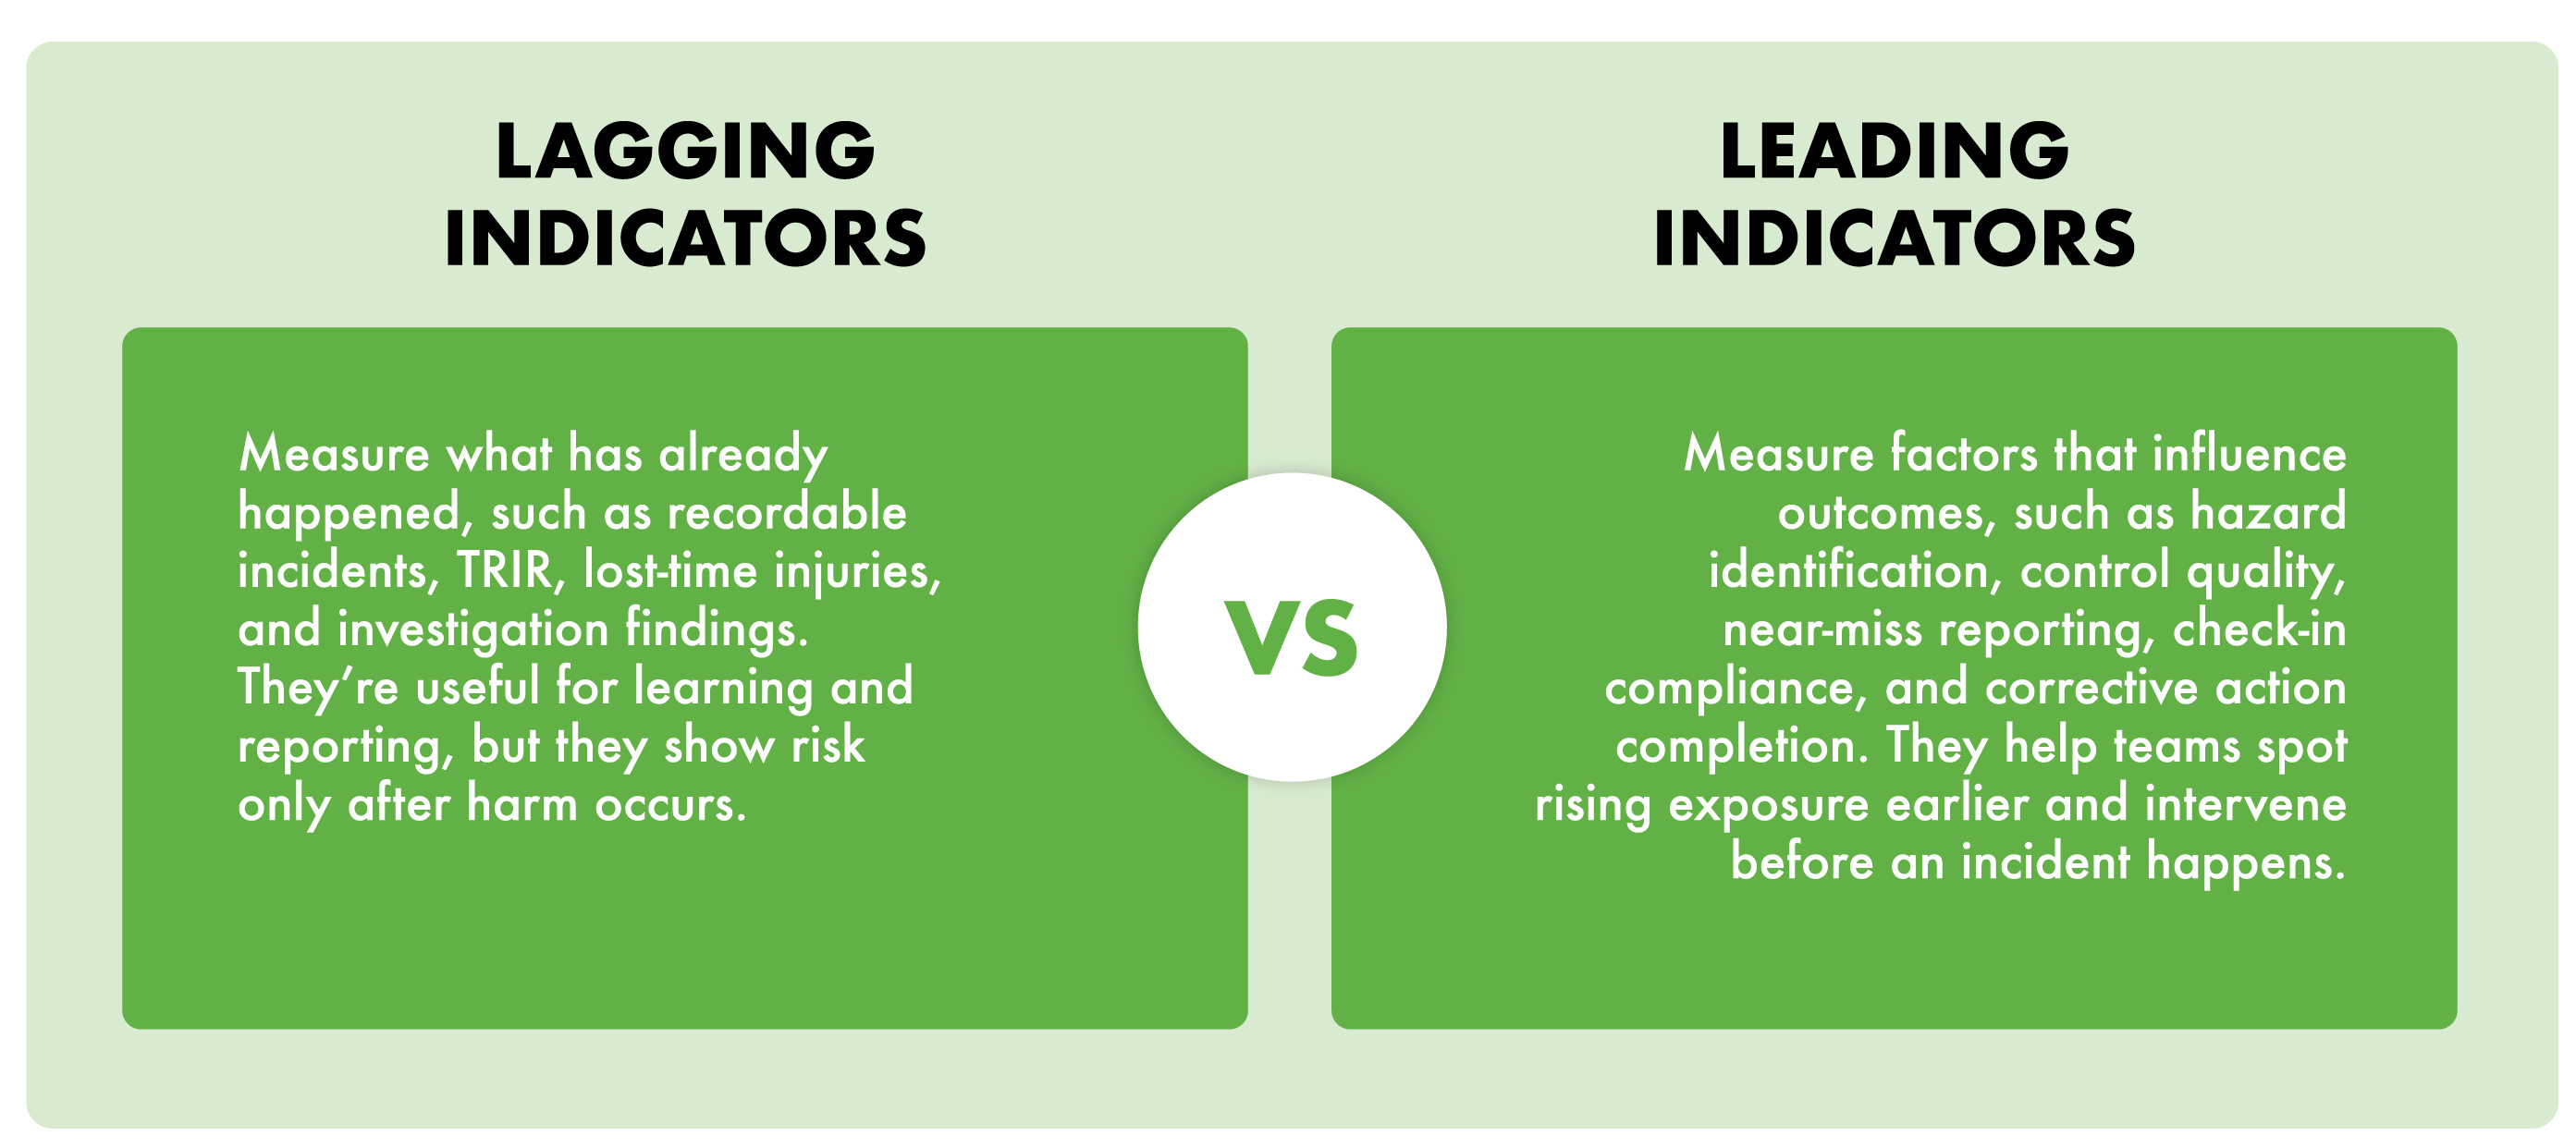
Traditionally, safety programs have relied on lagging indicators such as incident reports, investigation findings, recordable incidents, and compliance audits. Although valuable for learning and accountability, they reveal risk only after harm has occurred.
Research groups like the Construction Safety Research Alliance (CSRA) have been pushing the industry to look beyond lagging statistics like the Total Recordable Incident Rate (TRIR), supporting the idea behind AI-driven safety: prevention improves when we learn from leading indicators and control quality, not just injury counts.
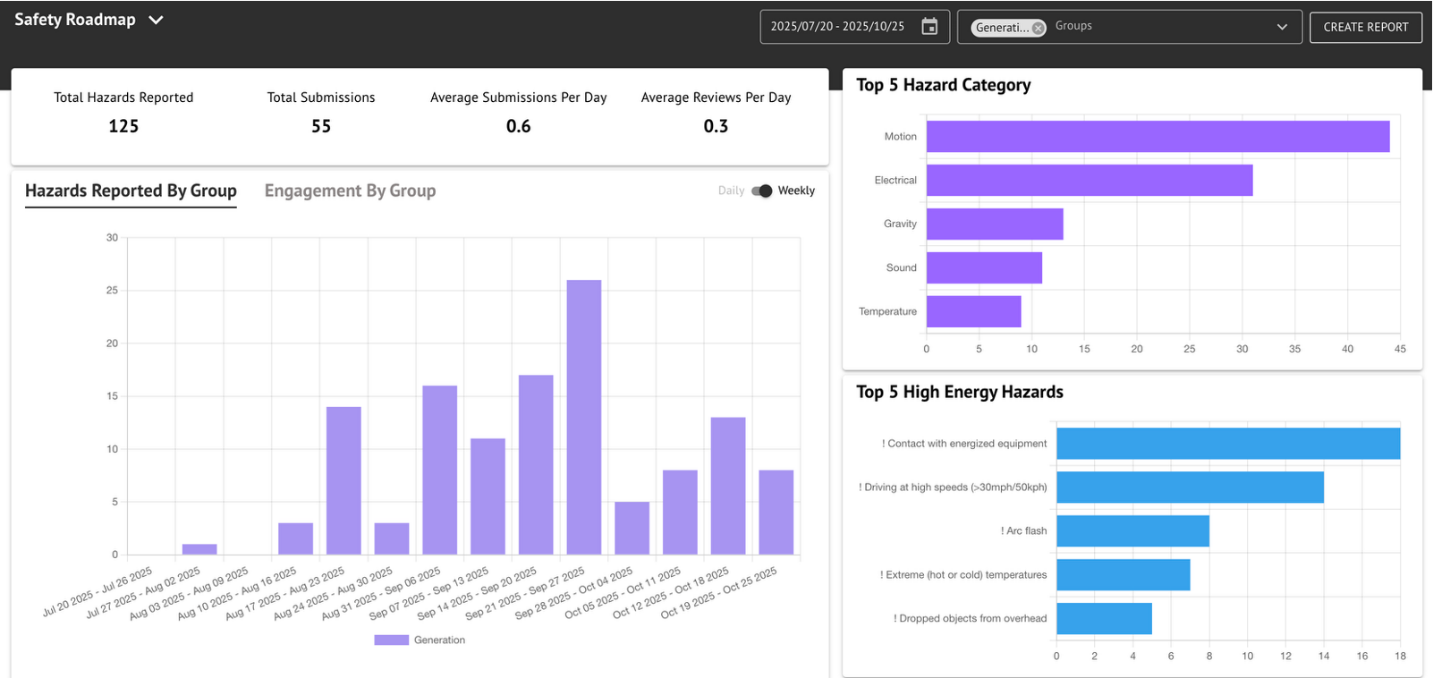
Best-in-class safety solutions use machine learning to analyze data such as hazard submissions, high-energy controls, near-miss trends, operational tempo, and field signals to spot anomalies, predict emerging hotspots, and highlight groups or tasks where risk exposure is accelerating. This gives safety teams earlier warning and more time to intervene, reducing both the likelihood and severity of incidents.
In workplace safety, AI-powered analytics can look across:
and surface combinations that have traditionally led to trouble. From there, safety teams can adjust staffing, routes, timing, training, or controls to prevent injury.
For lone workers, that proactive view can be the difference between a close call and a serious injury.
Technologies such as lone worker monitoring and journey management accelerate response times and provide an important lifeline for lone and other at-risk workers when check-ins are missed. AI lets us add something new: data-informed insights into common hazards in the area and which tasks are at a higher risk of an incident, BEFORE an alarm is triggered.
H3 Real-World Example – AI Hazard Identification
Two similar sites, operating under the same corporate safety program, approached their daily work with very different levels of hazard visibility.
Site A
Site A consistently identified a primary high-energy hazard related to midstream operations as one of the most serious risks in its environment. Their workers documented it repeatedly in FLHAs, enabling supervisors and safety leaders to clearly see the pattern emerging. Because of this discernibility:
Site A didn’t just spot the hazard; they acted on it.
Site B
Site B performed similar work but did not identify the same high-energy hazard. Whether due to lack of awareness, inconsistent FLHA quality, or gaps in training, the risk went unrecognized and unaddressed.
This meant:
Site B wasn’t safer; they were simply unaware.
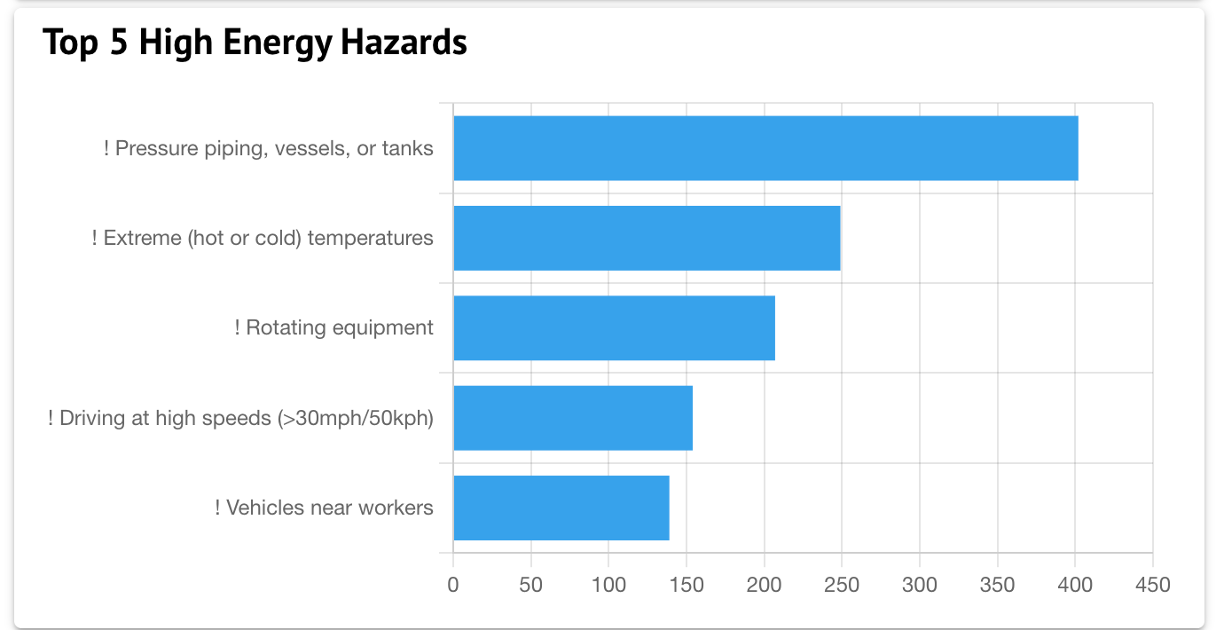

When operations escalated during a routine pressure-piping task, Site A’s team was already aware of the associated high-energy exposure. Controls were in place, verified, and communicated. The work proceeded safely.
At Site B, the same task carried more uncertainty. Because the hazard had never been formally identified, the crew did not apply the same level of control. Awareness was low. The margin for error was higher.
Site A identified and controlled a critical high-energy hazard. Site B didn’t even know it existed. A digital FLHA solution provides every site with the visibility needed to prevent serious incidents before they happen.
The difference wasn’t the task; it was the visibility of the risk.
H3 How a Digital FLHA Solution with AI Analytics Bridges the Gap
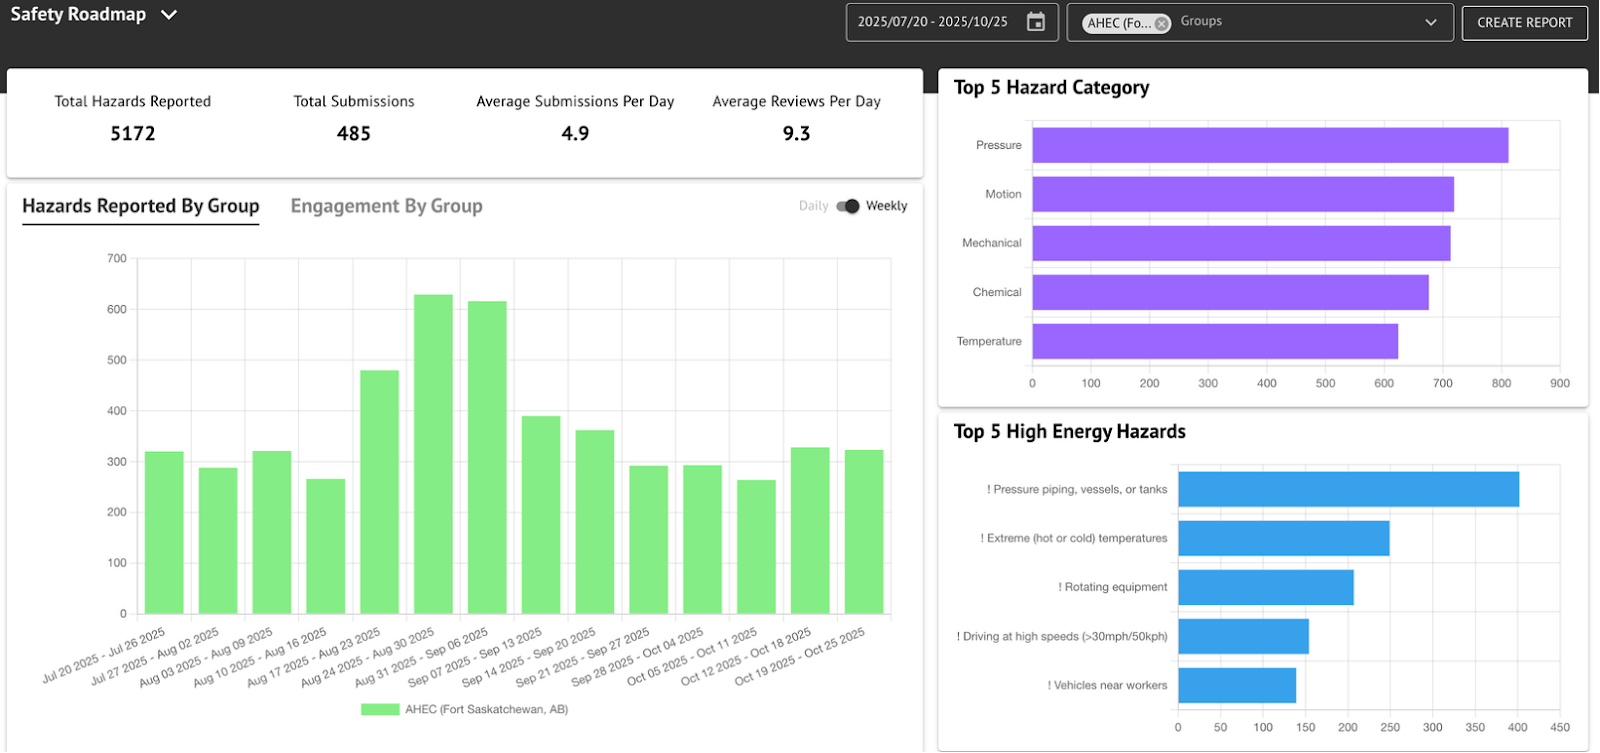
Field Safe’s FLHA platform transforms hazard reporting into real-time intelligence that leadership can act on. It makes certain that trends like those seen at Site A become visible across all sites, especially at sites that may be missing critical high-energy hazards.
Part 1 Wrap-Up: Visibility Is the First Step to Prevention
The difference between Site A and Site B wasn’t the work. It was the visibility. When high-energy hazards are consistently identified, and controls are documented with quality, leaders can verify, strengthen, and share what’s working before exposure turns into an incident. When hazards stay invisible, teams can look “safe” on paper while risk quietly builds in the field.
That’s why predictive safety starts with a strong foundation: reliable field data, consistent hazard recognition, and control quality you can trust. Once you have that, AI can do what humans can’t do at scale: scan thousands of check-ins, journey logs, hazards, and corrective actions to spot patterns early, prioritize what needs attention, and push the right guidance at the right time.
In Part 2, we’ll move from visibility to prediction: how AI identifies risk hotspots, powers context-aware alerts through geofencing, and helps HSE teams make faster prevention decisions, while keeping people firmly in the loop.
Part One FAQ
About the Author:

Doug Junor has been driving business transformation across North America for more than 35 years, helping organizations spot and act on emerging innovations that challenge the status quo. Clients value Doug’s ability to translate new technology into practical strategies that create operational and competitive impact.
Previously, Doug served as Chief Business Officer at Robots & Pencils, an award-winning mobile development firm, where he oversaw digital initiatives across multiple industries and led digital transformation work long before it had a name. Doug also brings his experience into the classroom, having developed and delivered programs through SAIT’s School of Advanced Digital Technology, including Transformational Leadership for Executives and Digital Strategy and Leadership.
Follow Doug on LinkedIn: https://www.linkedin.com/in/dougjunor/